Design Rule Checks (DRC)
We offer a native, integrated DRC engine that provides a thorough inspection of a photonic integrated circuit (PIC) layout. It checks for strict compliance with all foundry-specified rules, ensuring your design is ready for tape-out with your chosen PDK. Please contact our support team to learn which foundries have DRC decks available.
Running DRC checks
DRC checks can be run in two ways:
Using the Luceda Layout visualizer: You can run checks directly on your circuit layouts and visualize violations of the foundry-provided rules in real-time. As you modify your layout code, you may refresh the layout visualization, allowing you to verify fixes instantly.
Through Python scripting: You can run the DRC checks on a GDSII file independently of an IPKISS license, and visualize the violations. This method is ideal for automated flows and regression testing.
Running a full foundry deck on complex layouts can be computationally intensive and visually overwhelming for designers. To simplify debugging, both methods allow you to select specific groups of rules from the deck to run. This makes it easier to isolate and resolve errors incrementally. For example, you may choose to run only density rules (for which dummy filling is automatically performed if set up in the PDK according to the foundry specifications), or only checks on metal layers.
In this guide, we will use the Beneš switching network circuit from the Tape-out preparation and verification tutorial to demonstrate our DRC engine.
Luceda Layout visualizer (GUI)
For users who prefer a visual interface, you can import the DRC deck directly within the visualizer to run checks and inspect errors on the fly. We can run DRC on a Layout or on a loaded GDSII file. When running DRC on a GDSII file from the visualizer you don’t strictly require an IPKISS license, only a DRC license. First you need to open your circuit in the visualizer:
GDSII file: open the Luceda Layout Visualizer from the Luceda Control Center and load your exported GDS file (or click on Load GDS if the visualizer is already opened)
Layout: Run a visualize() method of your layout from your Python script.
In this case we will run the 2_drc_4x4_switch_crossing.py script from the /luceda_academy/training/topical_training/tape_out_prep_verification/drc folder, the layout will open. We have modified the script to visualize only the 4x4 switch and its flattened version. You will then see the following view, where you can click on the DRC icon:
DRC button highlighted with mouse hovering over.
Clicking the icon opens a pop-up window:
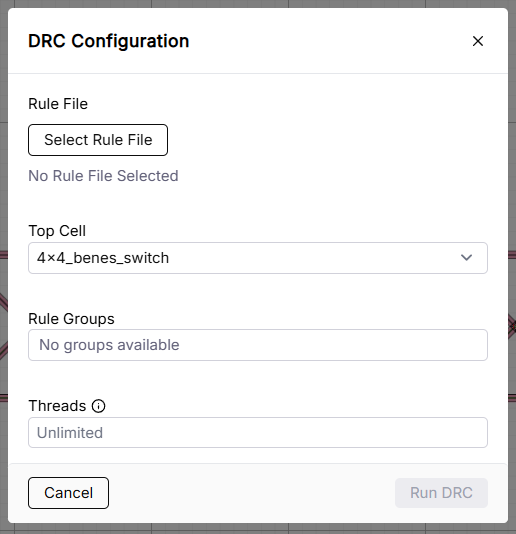
Pop-up window of DRC button.
To run DRC, you must select a rule file by clicking the ‘Select Rule File’ button. Rule files are part of the PDK. You can find them by navigating to the techfiles folder within your PDK and selecting the .rule file. This file contains the foundry-specific rules.
Note
You can easily install PDKs through Luceda Control Center. It provides an environment where you can explore different PDKs, switch between versions and access their documentation. More information can be found in this guide.
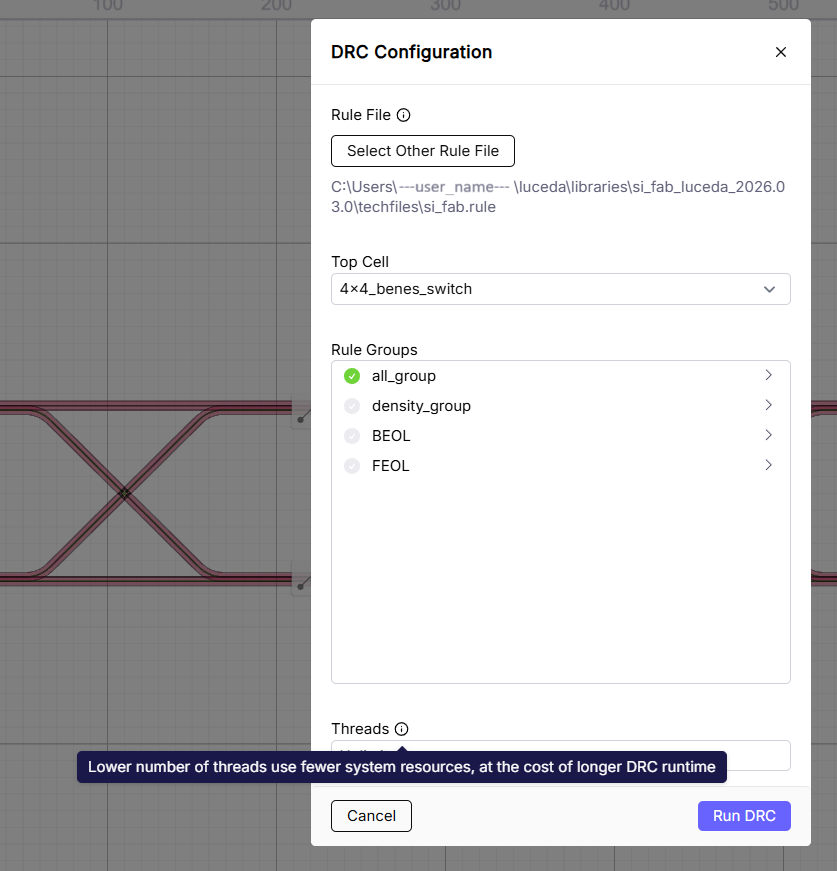
Pop-up window for the 4x4 switcing network circuit
The other fields are populated with default values. Let’s go over them one by one.
Top Cell: By default, the top cell of the design is selected. You can select a different PCell at any level of the hierarchy through the ‘Top Cell’ drop-down menu.
It is possible to run DRC on a subcell through the cell hierarchy pane in the Luceda Layout visualizer as well. You can right-click on a cell in the cell hierarchy pane and select Run DRC. This will open a new tab with DRC results on that cell.
Note that the area for density checks is inferred from the layout. This means that a DRC run of density in a subcell might give a violation so we advise to properly adjust the group for subcells.
Rule Groups: You can specify which group of rules to check. By default, all rules are included. For this specific layout, for instance, we are interested in the rules for the Si, cladding, heater, and metal1 layers.
Threads: This setting controls the system resource allocation for the DRC inspection. By default, the DRC engine uses all available threads. While this is fine for smaller circuits, it can consume all available computing power for larger designs. It is advisable to limit the number of threads for a time-consuming DRC run, allowing you to use your computer for other tasks. A lower number of threads uses fewer system resources but results in a longer DRC runtime.
DRC results
From the Tape-out preparation and verification tutorial, we know that the initial circuit without crossings is not DRC clean. It has overlapping layers and acute angles. Adding two crossing components (which is the circuit we tested on) fixes the overlapping layers.
The DRC engine then detects the acute angles, as well as snapping errors and others. Snapping errors often arise from rotated components, which is the case for our two crossings. The result is in the following figure:
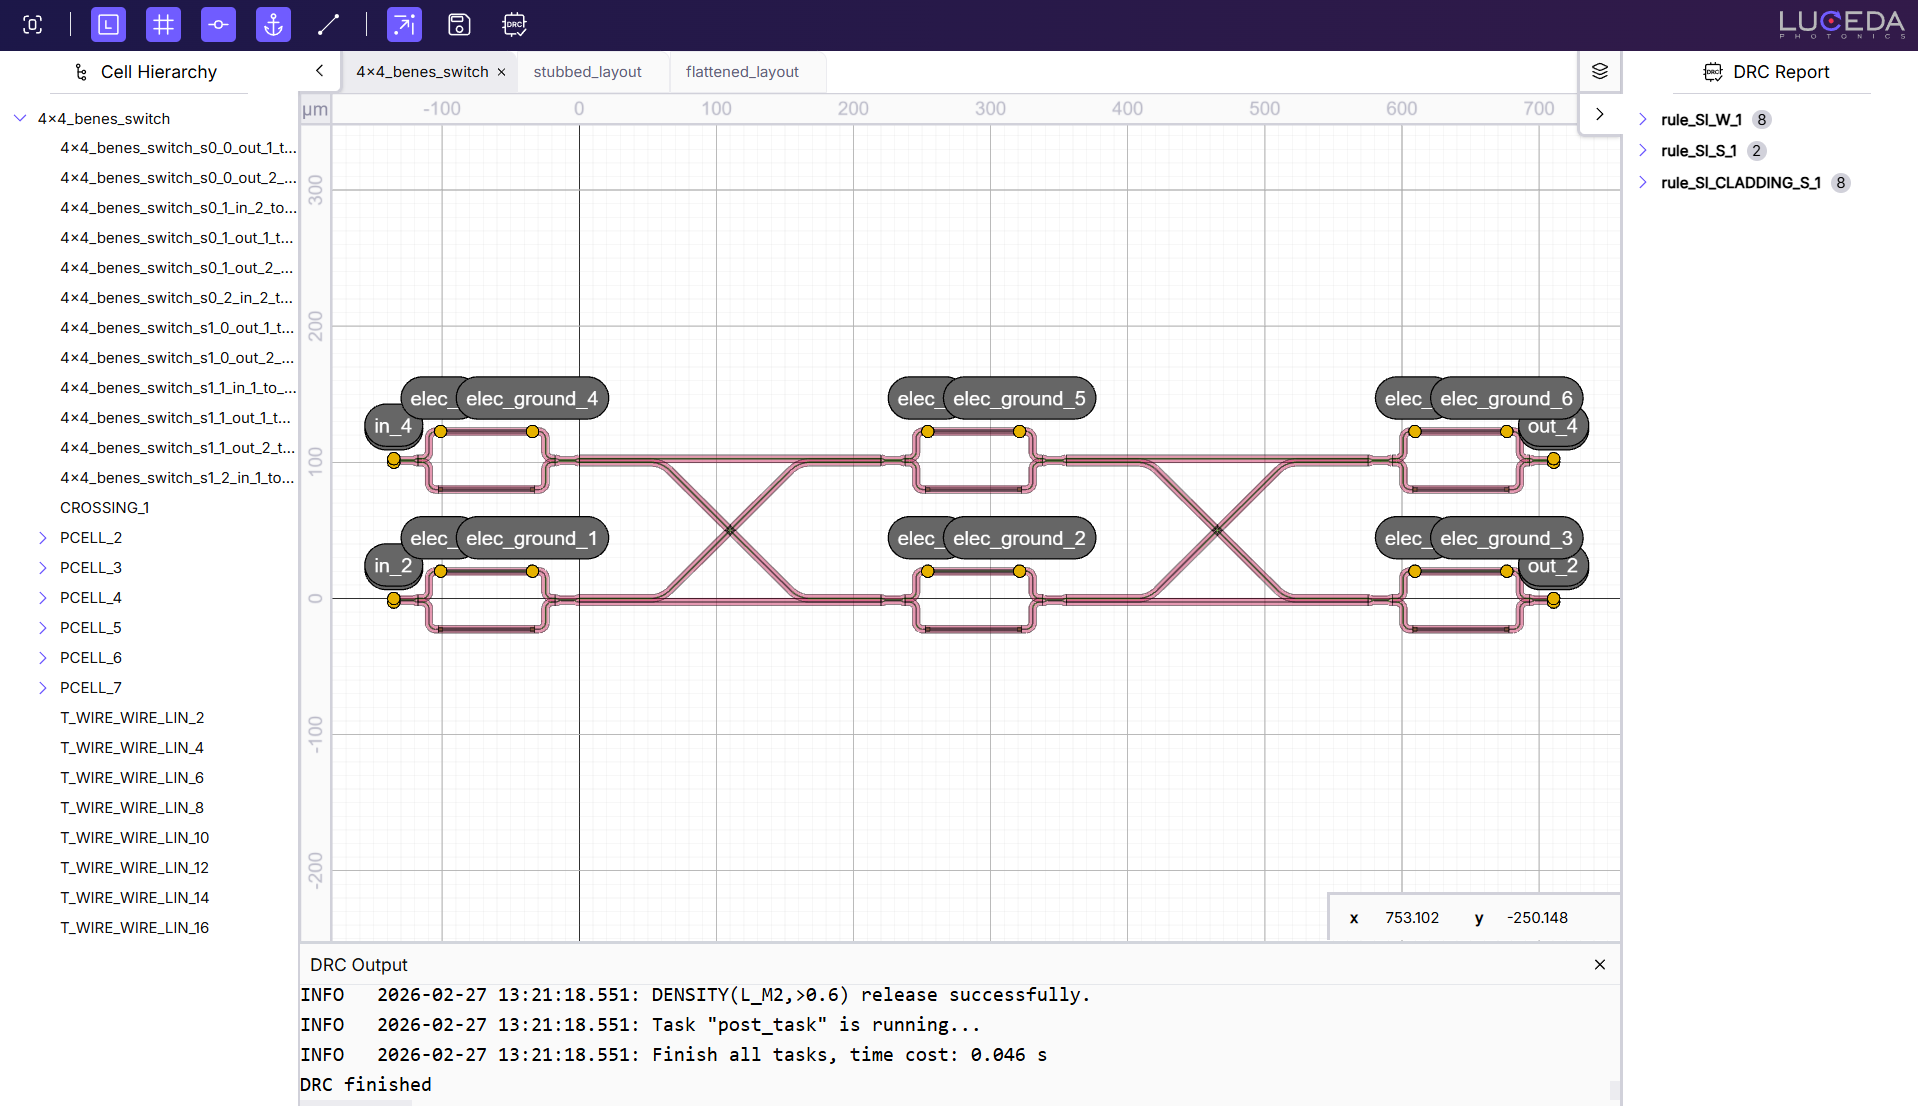
DRC immediate results. Violations on the right hand side and a lower section showing the engine output.
The detected violations appear on the right-hand side. You can see the standard ‘Layers’, followed by our DRC results.
The GUI provides several useful visualization functionalities:
Click on a violation to highlight it in the layout and to automatically zoom in on it.
Use the keyboard arrows to navigate to the next or previous violation.
Click on the group of violations to highlight and adjust zoom to the group’s violations instead of one by one.
You can select several violations to be highlighted and zoom adjusted by using the CTRL key and selecting them.
Checking the violations in the Luceda Layout visualizer.
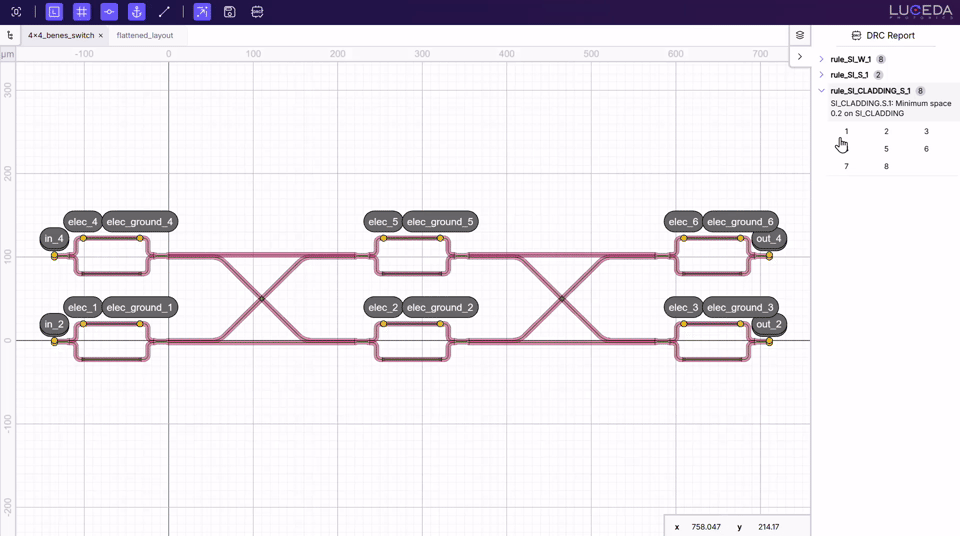
As the script adds stub elements (fixes acute angles) and flattens it (fixing snapping errors), running the DRC in flattened_layout cell will return the following:
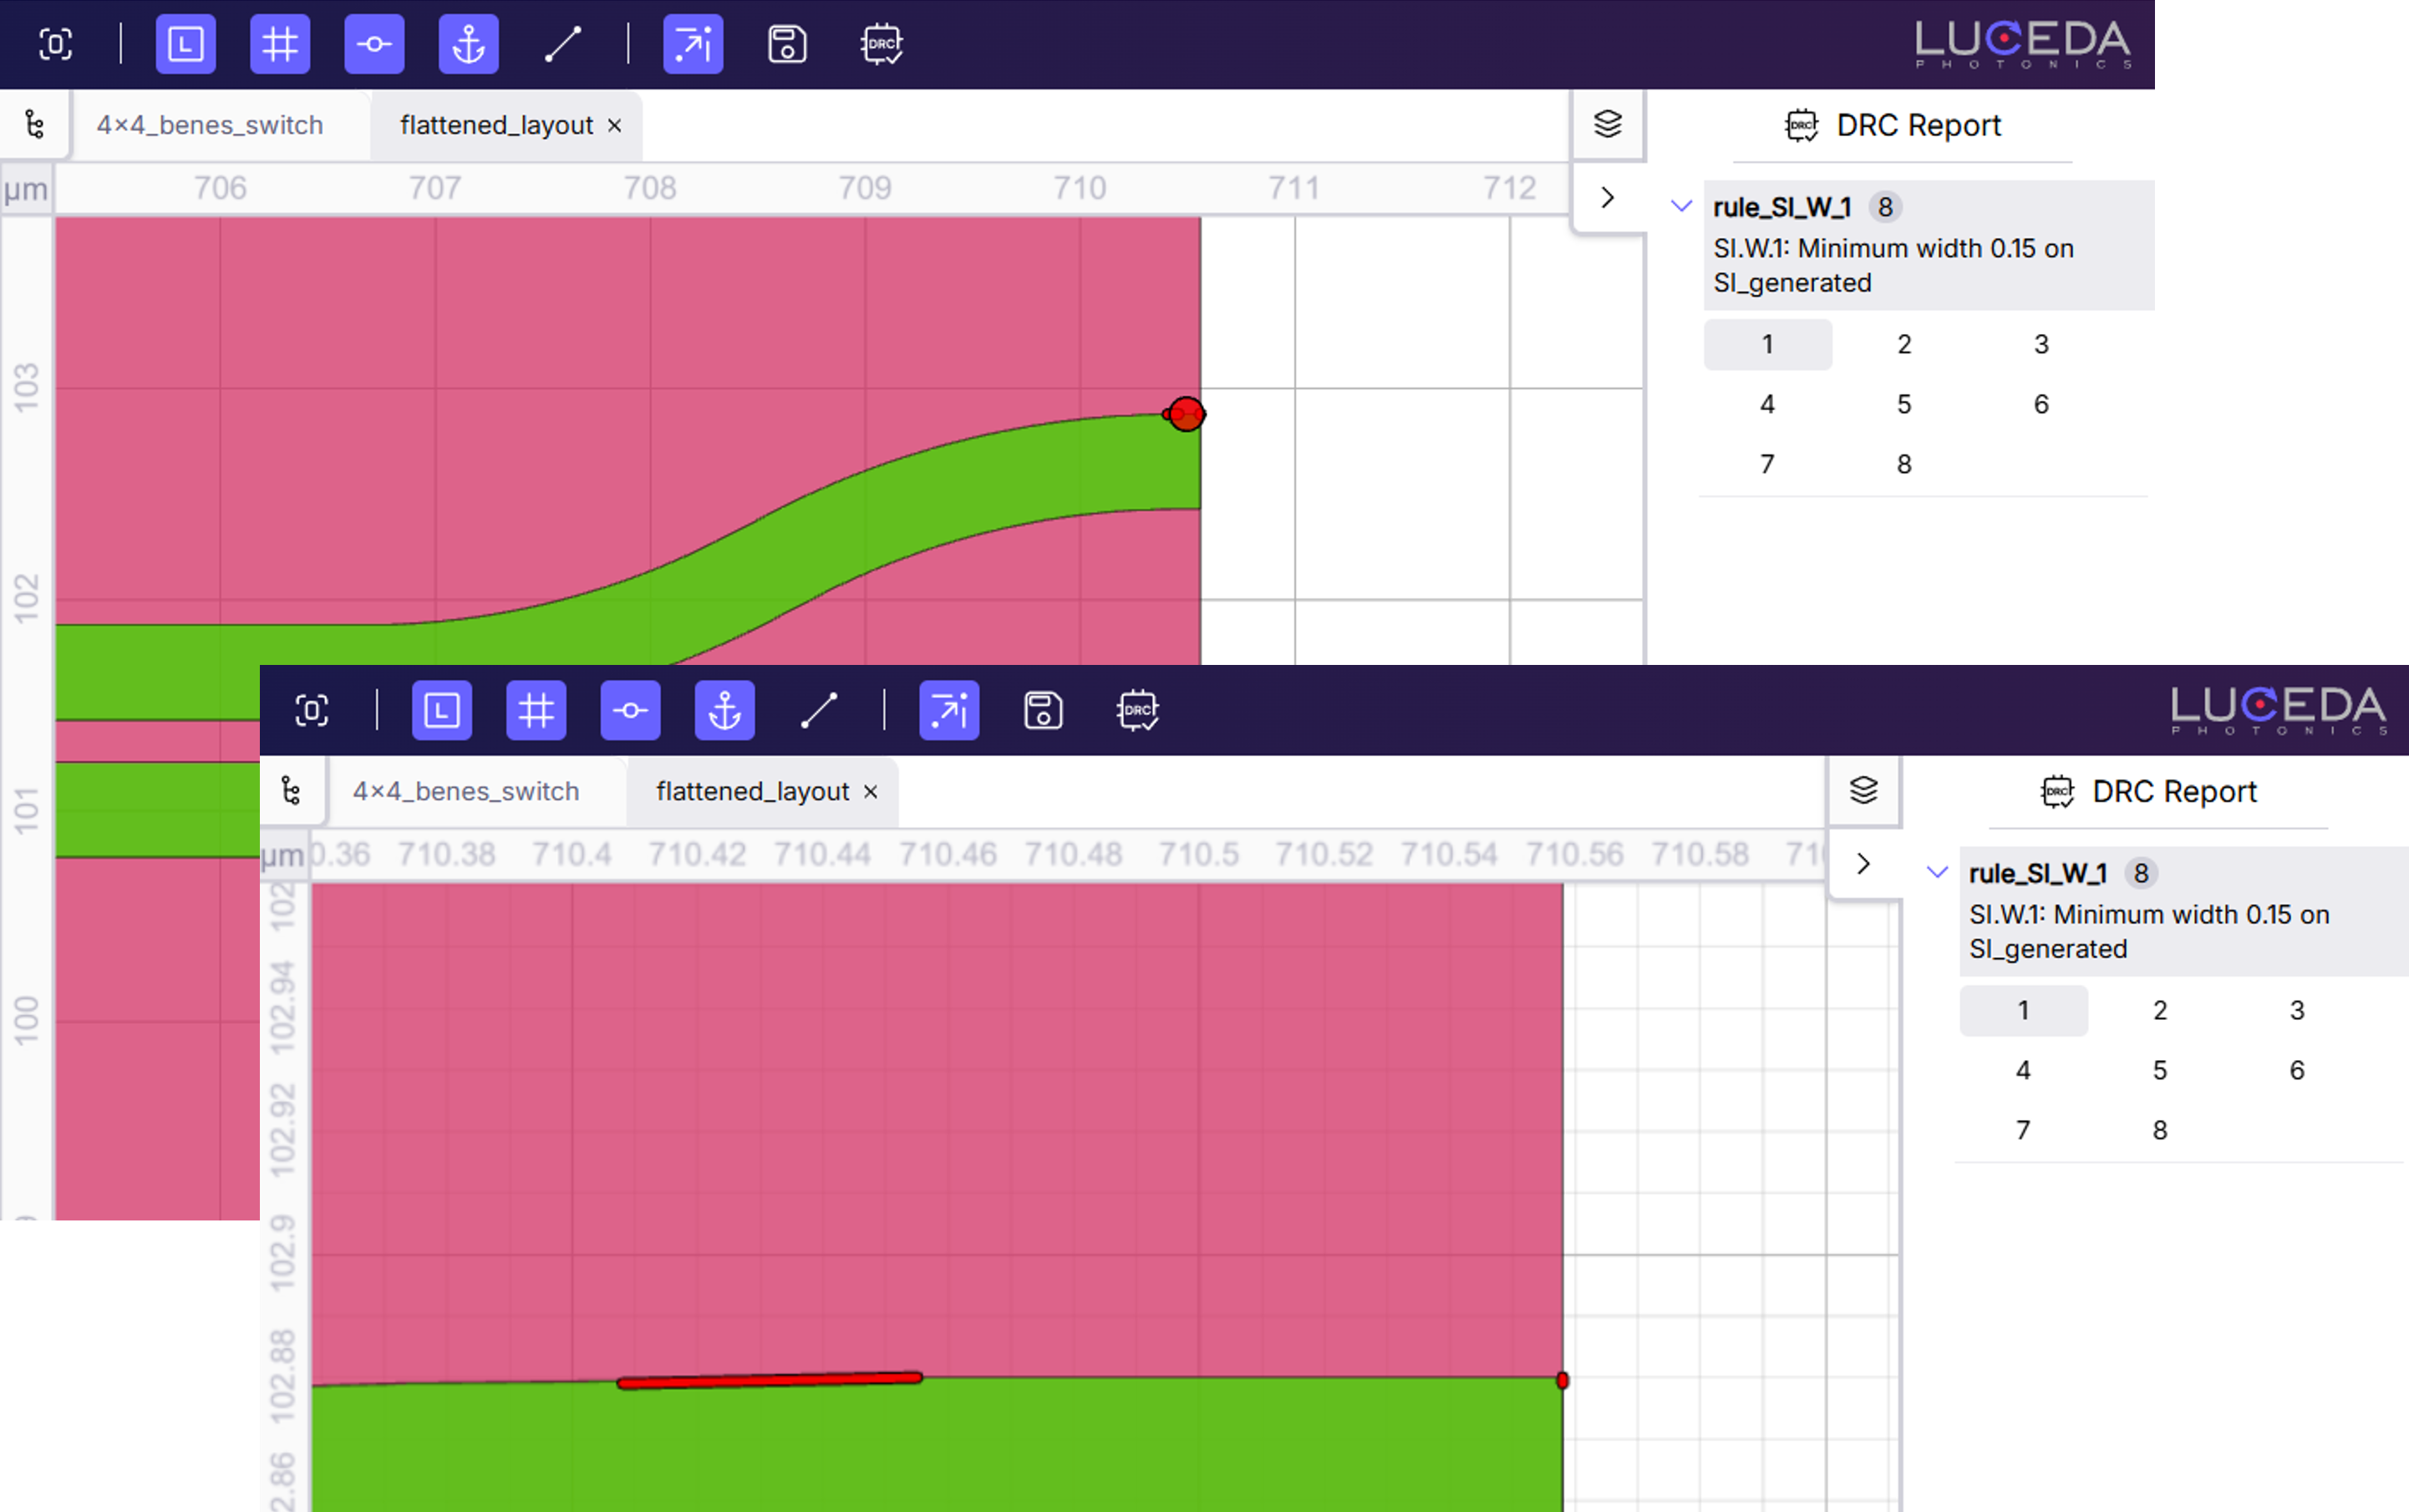
Check on flattened layout with stub elements added.
There is one violation we didn’t solve. It is flagged as a minimum width violation due to end of bend. Even though it might not seem intuitive at first, this error is expected at this stage because the directional coupler is not yet connected to optical I/Os. Once the circuit is finalized and integrated with other components (such as grating or edge couplers), the error will resolve automatically.
Python scripting (code environment)
For automated flows, you can trigger the DRC engine directly in your code. This is ideal for regression testing, as it creates a .lyrdb file that can be used for comparisons between different checks. In this case you can also run tests without an IPKISS license, using only a DRC license.
For the same circuit, we can write the following code:
from drc_4x4_switch_crossing import Switch4x4_Benes
import luceda.drc as drc

gds_path = "switch_4x4.gds"
switch_layout = Switch4x4_Benes(name="4x4_benes_switch").Layout()
switch_layout.write_gdsii(gds_path)

# the user should update the rule_file path to their user name
drc.run_drc(
    gds_file=gds_path,
    rule_file=r"C:\Users\user_name\\Luceda\libraries\si_fab_luceda_2026.03.0\techfiles\si_fab.rule",
    top_cell_name="4x4_benes_switch",
    db_output_file="switch_4x4_drc_results.lyrdb",
    show_engine_output=True,
)

drc.open_markers_in_klayout(
    gds_path=gds_path,
    marker_db=[
        "switch_4x4_drc_results.lyrdb",
        "switch_4x4_drc_results_density.lyrdb",
    ],
)
The script instantiates the circuit, saves it as a GDSII file, and then uses the luceda.drc.run_drc() function.
The required arguments for this function are the GDSII file to be checked, the rule deck file, and the name of the top cell to test.
In the GUI, the top cell options are presented automatically, with the highest cell in the hierarchy selected by default.
You can optionally provide other parameters, such as the db_output_file name, include_groups to select a specific group of rules (the default is all rules), the number of threads, and more.
Everything that can be done in the Luceda Layout visualizer can also be done through code. The main difference is that the scripting approach generates a .lyrdb marker file.
A few notes about the code:
GDSII cell names cannot contain certain special characters nor spaces. If your PCell name has them, the Luceda Layout visualizer will handle this automatically. However, when scripting, the names will be converted to a GDSII-compatible format.
luceda.drc.run_drc()takes a GDSII file as input. You can use a GDSII file generated from your layout and pass it directly to this function.Density checks are run separately. This means a second results file for density violations is automatically created, based on the name of the .lyrdb file.
Through code, we ran the same circuit and rule deck for DRC checks. Now we need to visualize the results.
Visualize DRC results with marker file
The marker file generated by luceda.drc.run_drc() can be visualized in different ways.
Since the 2026.06 release you are able to visualize this marker file inside the Luceda Layout Visualizer. Inside the visualizer you are able to select Load DRC Report when hovering the DRC button. Selecting the correct .lyrdb marker file will display the marker errors on top of your layout or GDSII file. Then you can use all the same functionalities inside the visualizer to scroll through the marker errors.
Alternatively, running luceda.drc.open_markers_in_klayout() as mentioned in the script above, will automatically open KLayout for visualization purposes.
A window with the following will appear:
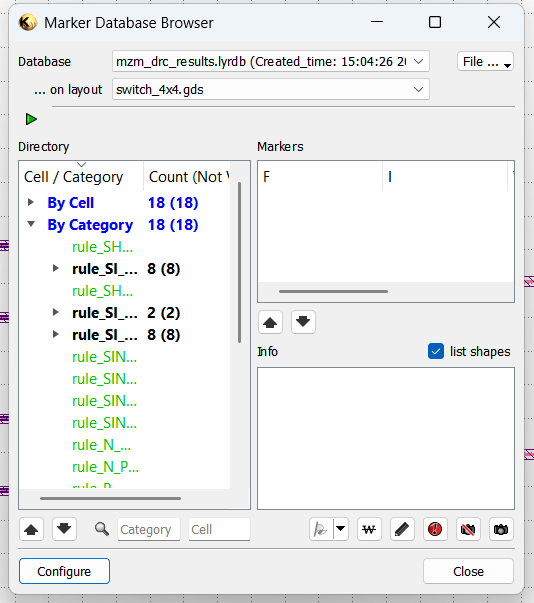
KLayout violations window of the DRC engine.
We can see that the same results are achieved by code, as expected. We can select which violations file to observe as well.
In a similar way, the violations can be zoomed in and highlighted:
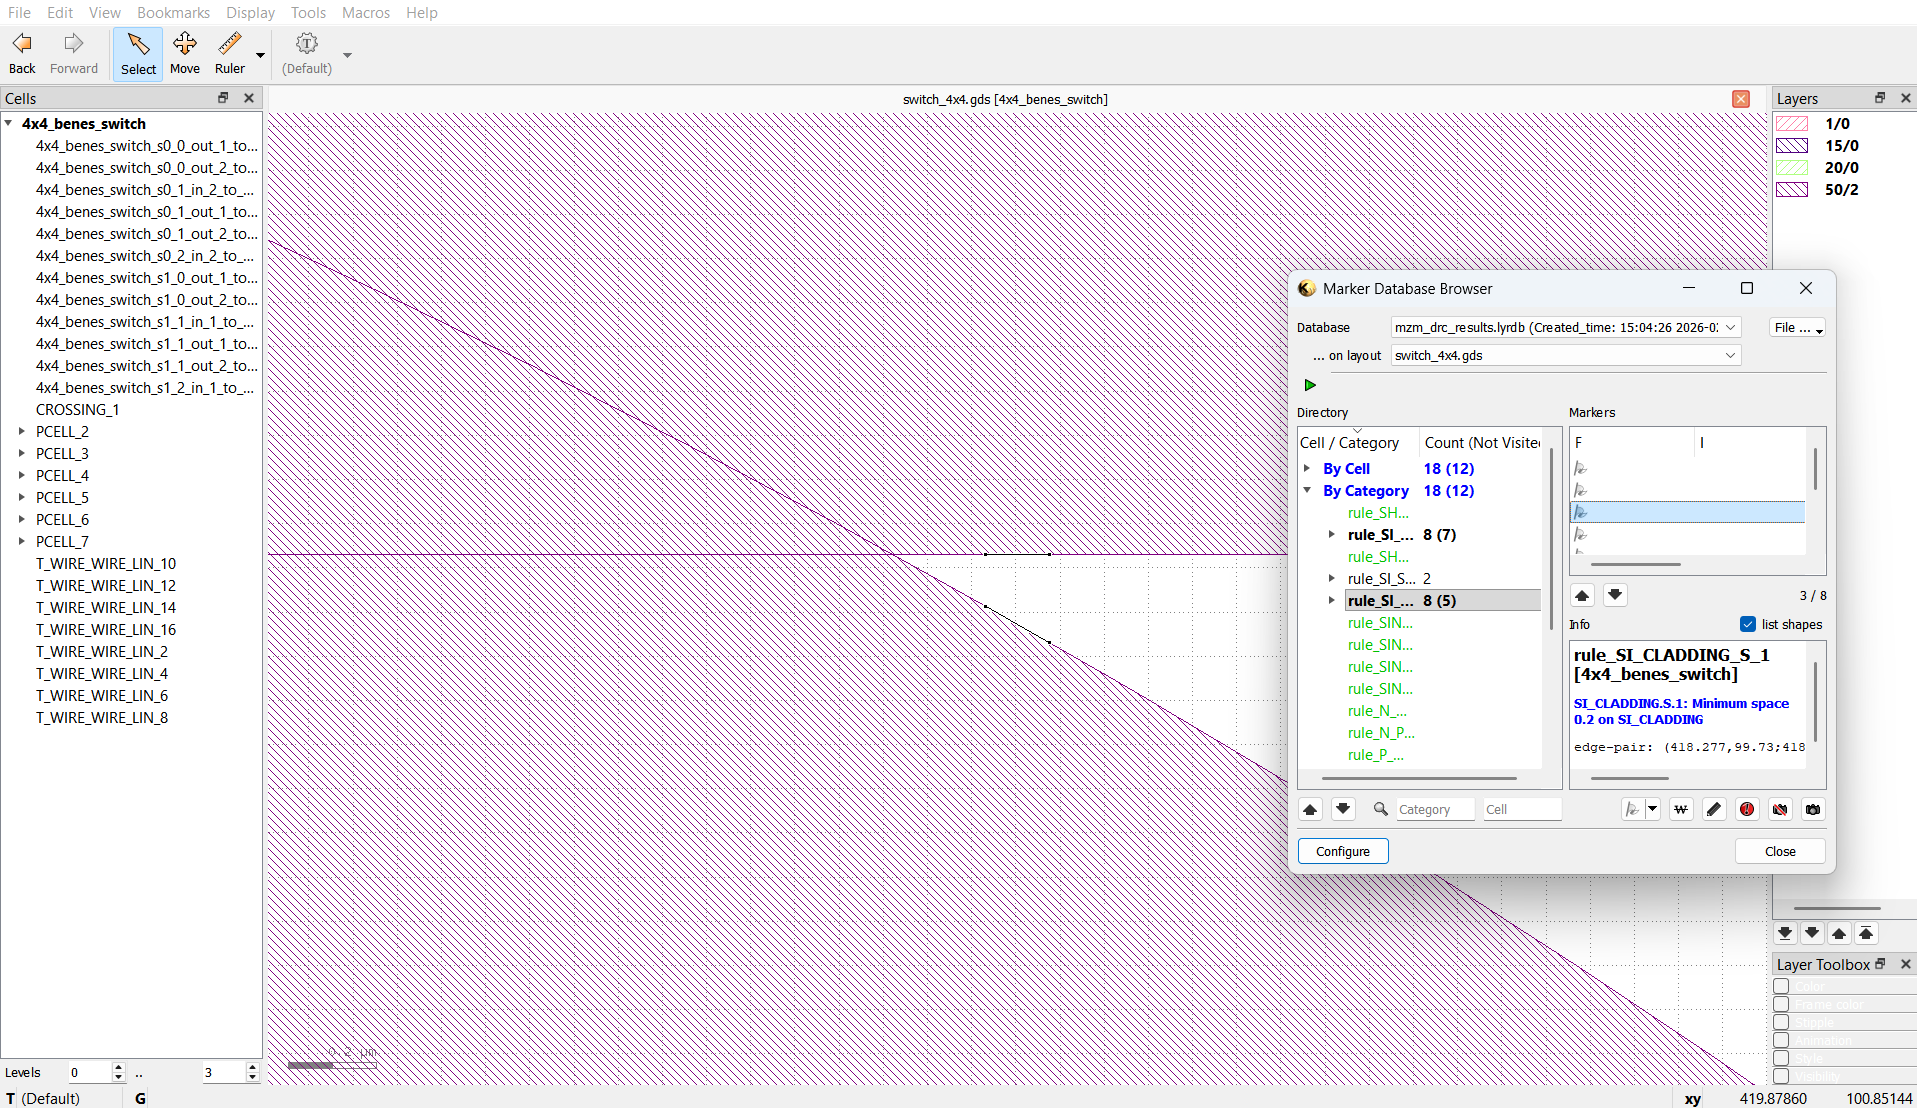
Visualizing violations on the GDSII file.